Subsequent to multiple healthcare professional complaints, we are adjusting the way we review promotional messages based on Kaplan-Meier analyses. Effective immediately, we are making changes relating to qualification per code section 4.2.3. Additional changes relating to accurate representation of data will be implemented beginning April 2021.
Key learning:
Key learning:
Note: The term "estimate" is not required in APS. The video showcased that the curves are an estimate following the first censor simply to explain why the language often appears in survival analysis literature.
Key learning:
While the videos explain the fundamental concepts, this section outlines how the concepts are applied from a review perspective.
Provision 1: Median time-to-event and/or timepoint estimates are only permissible in conjunction with the corresponding curve plot or the plot's summary estimator (i.e., the hazard ratio)
Without the KM curve, the 1-KM curve, or the hazard ratio, the median time to event and/or timepoint/milestone estimates are potentially misleading as they pertain only to a specific point in time (i.e., they can convey a selective and false sense of the overall inter-group relationship (in the absence of the HR or curve plot) as they do not describe that relationship over the entire study period).
Provision 2: Statistical significance is required for HR and/or curves to appear as claims of benefit in APS
The statistical significance for the hazard ratio is also the statistical significance for the overall relationship between the study groups on BOTH the KM and the 1-KM curves over the duration of the trial. Unless sourced directly from the product monograph (in a manner that is consistent with monograph), the curves and their corresponding hazard ratio may only appear as claims of benefit if they are statistically significant.
Provision 3: Statistical analysis for the overall curves does not apply to individual points on the curves. This has implications for overt claims relating to timepoint analysis and median time-to-event. This will be implemented beginning April 2021.
Statistical significance for a comparison of the overall curves does NOT confer statistical significance to any specific point on the curve. Overt claims pertaining to the median time to event or to timepoint/milestone estimates are only acceptable when a statistically significant confidence interval or p-value specific for that particular inter-group difference is reported in the study.
Provision 4: HR is a relative estimate. It must be accompanied by corresponding data describing the difference in absolute terms to satisfy PAAB Code s. 4.2.3
At each mention of the HR, it must be accompanied by prominent disclosure of the inter-group difference expressed in absolute terms per s. 4.2.3. This can be accomplished through accompaniment with one or more of the following:
The median time to event does not convey the inter-group difference in absolute terms if it is not reached in EITHER of the study groups. Some other method needs to be used to convey the magnitude of the absolute difference in those instances. It is acceptable, however, for the confidence interval boundary of the median time to event to not be reached as significance is not required for claim neutral presentation of median time-to-event in the respective groups when accompanying the hazard ratio and/or the curve as discussed below.
Timepoint/milestone estimates differ throughout the graph. The time point that the estimate pertains to must therefore be incorporated into this APS statement.
# of participants who experienced the event of interest in each group along with the initial n-value of each group (or the percentage of each group who experienced the event of interest)
Options i, ii, or iii are preferred over option iv alone (as the latter technically conveys the cumulative risk difference in absolute terms as opposed to the instantaneous risk difference in absolute terms).
Although iv is an acceptable option that simultaneously addresses the requirements of both provisions 4 and 6 in this document, it is not the preferred approach to address the provision 4 requirement.
Statistical significance is not required for ii or iii when presented in a factual manner without embellishment (e.g., to satisfy s. 4.2.3). However, statistical significance would be required to add an inference such as "10% fewer participants experienced the event by year 2 in the drug XYZ group than in the..." as per provision 3.
Note that it would be inaccurate to represent this claim of "10% fewer participants..." as a reduction in instantaneous risk, as timepoint/milestone analysis utilizes cumulative risk (i.e., the y-axis) as opposed to instantaneous risk (i.e., the hazards). Provision 6 below does not apply to timepoint/milestone analysis.
Provision 5: Implications of low remaining "# at risk" on timepoint/milestone analysis
The extreme right side of the KM (or 1-KM) graph must be interpreted with caution as the low "# at risk" can cause erratic curve behaviour. Some studies set minimum number of participants remaining at risk, after which the plots are curtailed. There are several approaches to set such limits. Regardless of the approach used, the PAAB will accept timepoint/milestone analysis at any point on the curve where this or any related form of restriction is determined a priori. In the absence of such imposed limits on the plot, the PAAB will restrict use of timepoint/landmark analysis to points in follow-up time where BOTH groups still have at least 10% of the initial sample size at risk. This applies equally to timepoint/landmark analysis performed for promotional statements AND to analysis performed for disclosure purposes. This is expected to have minimal impact on previously approved APS as these estimates are rarely taken from the extreme right side of the curve.
Provision 6: Disclosure of the # of participants in each group that experienced the event out of the initial n-value of each group (or the percentage of each group who experienced the event of interest). This will be implemented beginning April 2021.
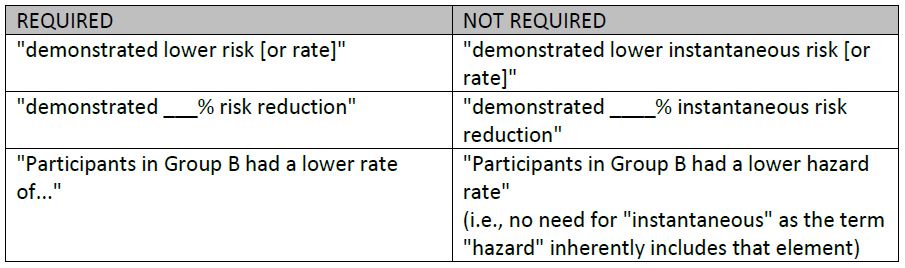
The videos convey that hazard ratios describe the relative instantaneous risk (as opposed to relative risk in the commonly understood sense). In fact, the relative risk (and therefore the relative risk reduction) can easily be calculated from the number of events for any survival study to reinforce that the hazard ratio tends to be quite different from the study period's relative risk. Nonetheless, this is a nuance that is not widely understood at the time this guidance was written. Additionally, many product monographs apply the meaning of "relative risk reduction" to 1-HR (1 minus hazard ratio). Therefore, although the PAAB recommends that the advertisers use technically correct language in advertising, we continue to accept language reflective of relative risk in hazard ratio presentations at this time. HOWEVER, when language pertaining to relative risk (rather than hazard rate or relative instantaneous risk) is employed in APS, prominent disclosure of the # of participants who experienced the event of interest in each group along with the initial n-value of each group (or the percentage of each group who experienced the event of interest) must appear within the presentation. This is intended to enable HCPs to understand that the terms do not relate to relative risk in the more commonly understood sense. This approach is also consistent with the vast majority of time-to-event presentations in product monographs. However, this requirement would apply equally when the monograph does not contain the # of participants who have experienced the event.
Examples of wording which trigger this disclosure requirement (and examples which do not):
NOTE: This disclosure requirement exists regardless of whether the KM (or 1-KM) curves are presented. This is in stark contrast to the disclosure requirement in item #4 above, pertaining to s. 4.2.3 (i.e., expressing the difference in absolute terms), which can be addressed in several ways including simply including the curves in the presentation. Although the curves depict the time-to-event relationship between both groups, it is typically not practical to attempt to determine the number of events for the entire study from the curves.
Provision 7: The HR is an ineffective summary estimator of the curves on the plot when there is a major violation of the assumption of proportional hazards (PH)
As discussed above, presentations of KM or 1-KM curves that are not statistically significantly different are not acceptable (PAAB s. 5.9). As a result, non-proportional hazards only impacts HCP advertising rulings where the curves, over the duration of the trial, are statistically significantly different in spite of their non-proportionality. Although a single HR estimate is a poor descriptor of the relationship between the curves when the PH assumption is violated, its confidence interval can still indicate that the curves are significantly different over the duration of the trial. Additionally, this level of significance is often also demonstrated, without concern for estimating the degree of difference, using a log-rank test or a Wilcoxon test. In instances where the PH assumption is invalid, the HR is not required to appear in the APS. Should the advertiser elect to include the HR, it may only be stated in a factual manner, without embellishment or interpretation, as part of the KM (or 1-KM) curve graphic. It may not be presented separately from the graphic, even on a summary page, in those instances. This provision is intended to convey to the HCP that the relative effect of the compared healthcare products changes substantially over time.
Non-PH can signal the presence of a statistical interaction. It might therefore trigger unplanned subgroup analysis generating KM curves and HR that are specific to the corresponding participant subset. Such analyses may provide valuable insights that guide future confirmatory studies. However, they are considered exploratory as the subgroup analyses were not preplanned. Exploratory subgroup analyses are not acceptable in advertising. For instances where subgroup analysis was preplanned, refer to the requirements outlined in the PAAB's Guidance on Subgroup Analysis.
Provision 8: Updates to APS based on subsequent interim KM analyses. Planned vs unplanned.
Any analysis that takes place prior to the preplanned end-of-data-collection-date, is considered to be interim in nature. This does not, in and of itself, impair acceptability of the presentation in the APS when these KM analyses are pre-planned and meet all applicable evidentiary requirements in the PAAB Code and guidances. However, new inferences may not be added to APS based on unplanned, or otherwise exploratory, KM interim analyses. This means that the use of matured data from an unplanned, or otherwise exploratory, KM interim analysis is limited to the following scenarios:
This approach is distinct from studies, or parts of studies, in which time has a more chronological sense (as opposed to referring to duration of follow-up).
Note that, as the x-axis of the curve is not time in the chronological sense, the length of the x-value on the curve is often not extended by subsequent interim analyses.
Also note that it is not unusual for a median time-to-event, which had previously not been reached, to be reached as the data matured in a subsequent interim analysis. This could provide useful information for the HCP particularly with regards to providing a general sense of the absolute magnitude of the difference between groups.
Table 1: Efficacy Results for Study 1 (ITT Population)
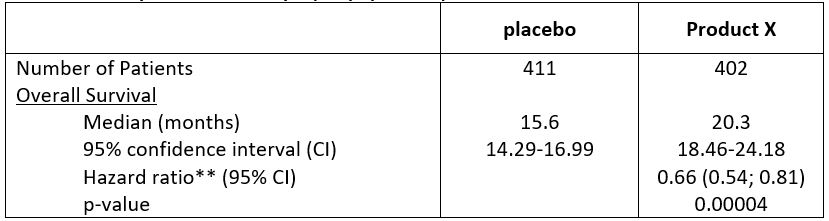
Figure 1: Plot of Kaplan Meier Estimates for Survival
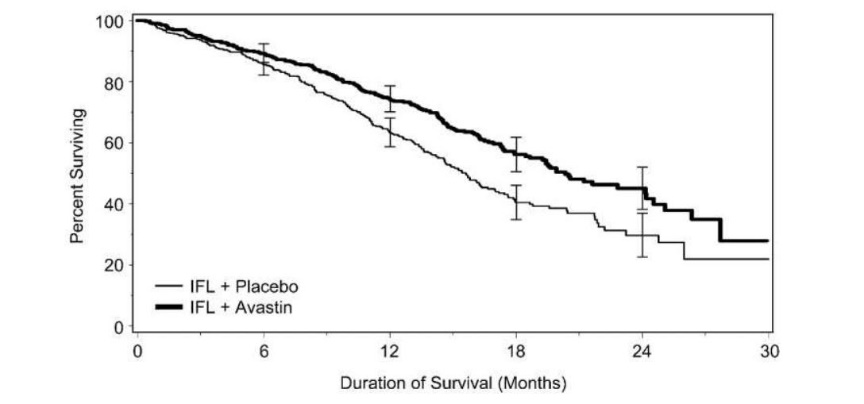
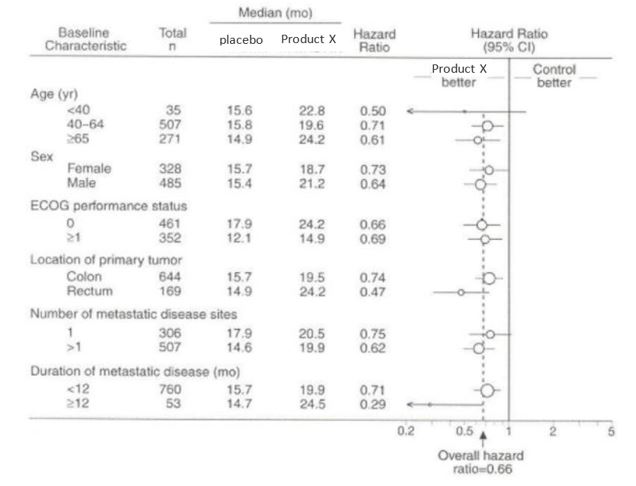
Figure 2: Duration of Survival by Baseline Risk Factor
Claim 1a - risk reduction (valid application until April 2021)
Product X demonstrated superior OS compared with placebo: 34% reduction in risk of death (HR 0.66 [95% CI: 0.54-0.81]; p=0.0004)
Qualification for claim 1a
Based on provision 4, qualify with ONE of the following:
Claim 1b - risk reduction (required application beginning in April 2021)
Product X demonstrated superior OS compared with placebo: 34% reduction in risk of death (HR 0.66 [95% CI: 0.54-0.81]; p=0.0004)
Qualification for claim 1b
As per provision 6, should the client choose to promote claim 1b, it must be qualified with iv above; this applies even if i, ii and iii are present.
An alternative claim (valid application beginning immediately):
Product X demonstrated superior OS compared with placebo: 34% reduction in instantaneous risk of death (HR 0.66 [95% CI: 0.54-0.81]; p=0.0004)
This can be qualified with any one of i, ii, iii and iv above.
Claim 2 – time
Product X significantly delayed time to death vs. placebo (HR 0.66 [95% CI: 0.54-0.81]; p=0.0004)
OR
Product X significantly prolonged time to death vs. placebo (HR 0.66 [95% CI: 0.54-0.81]; p=0.0004)
OR
Product X significantly prolonged overall survival vs. placebo (HR 0.66 [95% CI: 0.54-0.81]; p=0.0004)
Qualification for claim 2
Same qualification as for claim 1.
Acceptable:
Product X significantly delayed time to death vs. placebo (HR 0.66 [95% CI: 0.54-0.81]; p=0.0004)
Median time to death: Product X 20.3 months vs. placebo 15.6 months
Beginning April 2021, the following will NOT be acceptable as per provision 3:
Product X significantly delayed time to death vs. placebo: 20.3 months vs. 15.6 months (HR 0.66 [95% CI: 0.54-0.81]; p=0.0004)
This is because the HR and associated statistics relate to the entire KM curve and not to the specific measurement of mean time to death, which is a single point in time (i.e. when 50% of subjects in each arm experienced the event).
Beginning April 2021, the following will NOT be acceptable as per provision 3:
Claim 3
Promotion of the complete forest plot is acceptable without any additional qualification; it already fulfills provision 4 ii.
Please note that if either of the medians was NR, additional qualification would be required.
Table 2: Efficacy Results for Study 1 by IRC Assessment (ITT Population)
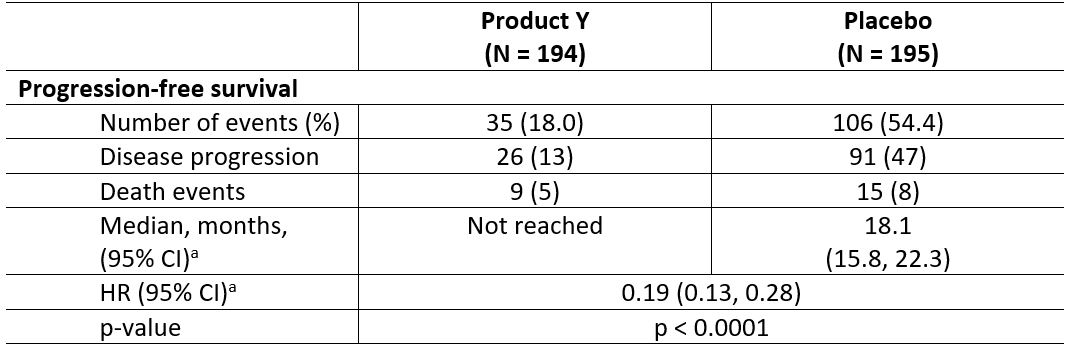
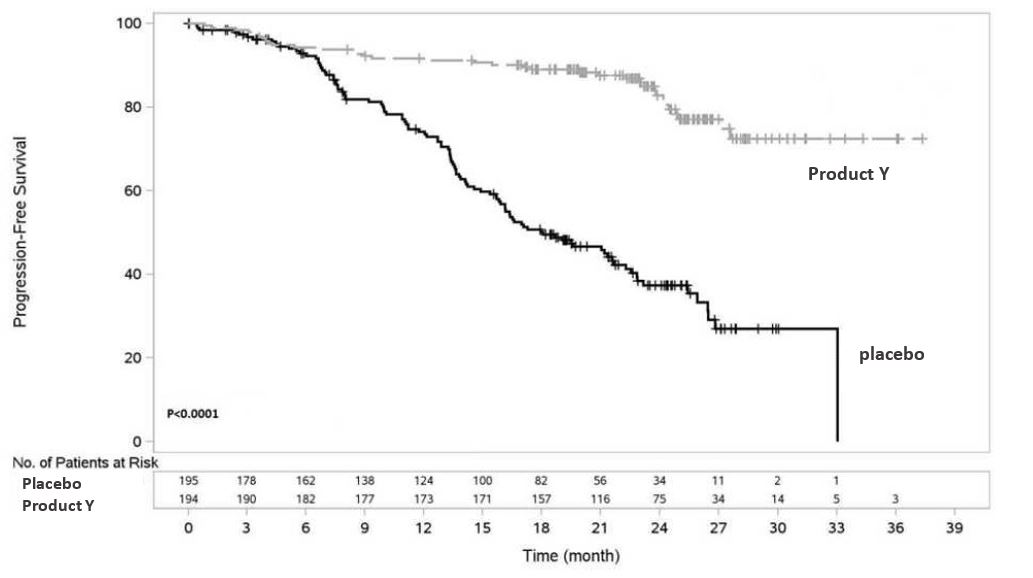
Figure 3: Kaplan-Meier Curve of IRC-Assessed Progression-Free Survival (ITT Population)
Claim 1a – risk reduction (valid application until April 2021)
Product Y demonstrated superior PFS compared with placebo: 81% reduction in risk of progression or death vs. placebo (HR: 0.19 [95% CI: 0.13‑0.28]; p<0.0001)
Qualification for claim 1a
Based on provision 4, qualify with ONE of the following:
Claim 1b - risk reduction (required application beginning in April 2021)
Product Y demonstrated superior PFS compared with placebo: 81% reduction in risk of progression or death vs. placebo (HR: 0.19 [95% CI: 0.13‑0.28]; p<0.0001)
Qualification for claim 1b
As per provision 6, should the client choose to promote claim 1b, it must be qualified with iv above; this applies even if i, ii and iii are present.
An alternative claim (valid application beginning immediately):
Product Y demonstrated superior PFS compared with placebo: 81% reduction in instantaneous risk of progression or death vs. placebo (HR: 0.19 [95% CI: 0.13‑0.28]; p<0.0001)
This can be qualified with any one of i, ii, iii and iv above.
Table 3: Clinical Endpoints from RRMS Study 1 and RRMS Study 2
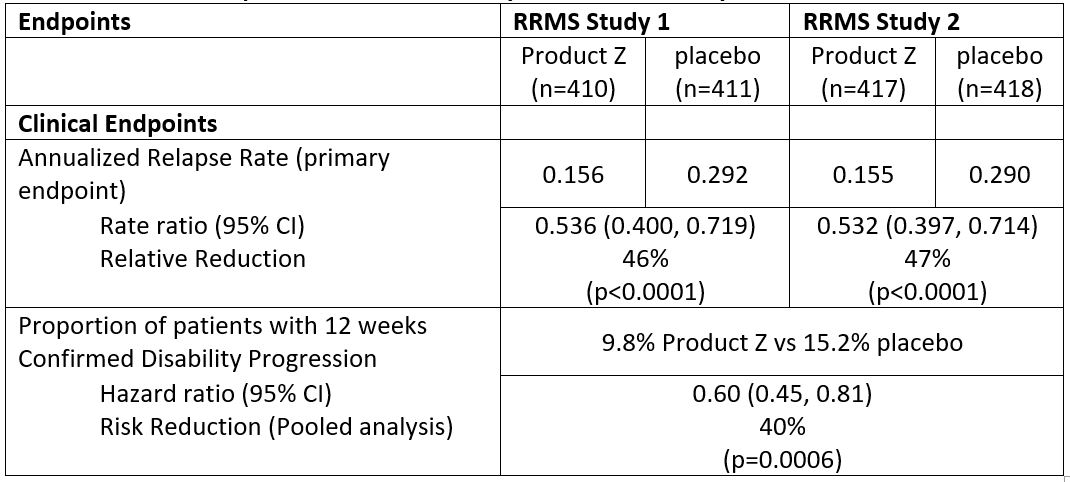
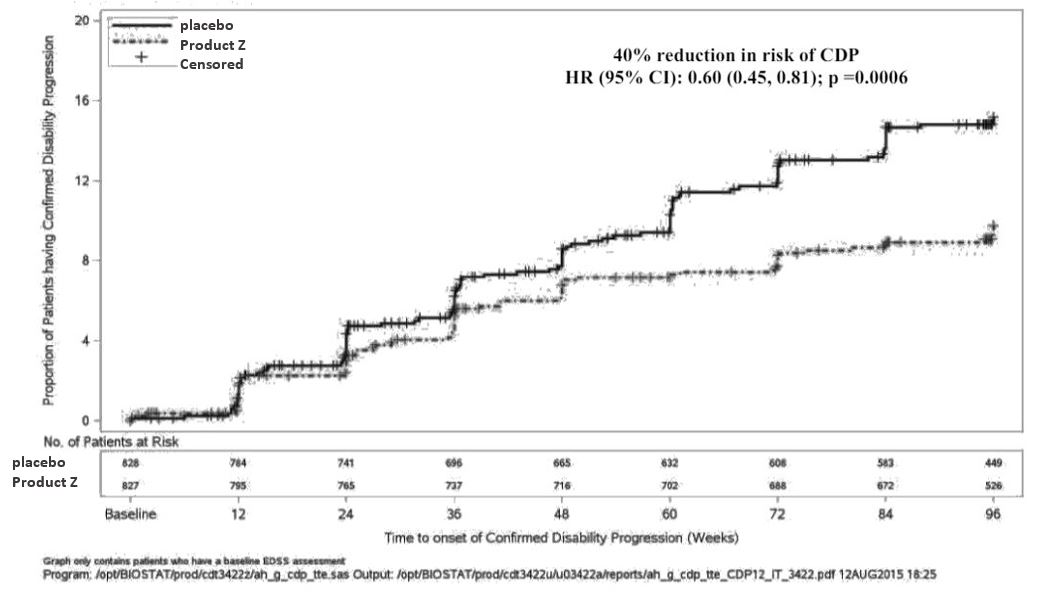
Figure 4: Kaplan-Meier Plot of Time to Onset of Confirmed Disability Progression Sustained for at Least 12 Weeks with the Initial Event of Neurological Worsening Occurring during the Double-blind Treatment Period (Pooled ITT Population)*
Pooled: RRMS Studies 1 and 2
Claim 1a – risk reduction (valid application until April 2021)
Product Z demonstrated 40% reduction in risk of patients experiencing 12-week confirmed disability progression compared with placebo (HR 0.60 [95% CI: 0.45-0.81]; p=0.0006)
Qualification for claim 1a
Based on provision 4, qualify with ONE of the following:
Claim 1b - risk reduction (required application beginning in April 2021)
Product Z demonstrated 40% reduction in risk of patients experiencing 12-week confirmed disability progression compared with placebo (HR 0.60 [95% CI: 0.45-0.81]; p=0.0006)
Qualification for claim 1b
As per provision 6, should the client choose to promote claim 1b, it must be qualified with iv above; this applies even if i, ii and iii are present.
An alternative claim (valid application beginning immediately):
Product Z demonstrated 40% reduction in instantaneous risk of patients experiencing 12-week confirmed disability progression compared with placebo (HR 0.60 [95% CI: 0.45-0.81]; p=0.0006)
This can be qualified with any one of i, ii, iii and iv above.
![]()
 View in Full Forum
In an effort to constantly serve our clients better, PAAB has unveiled a new electronic submission process(eFiles). Effective January 2, 2008 all submissions will have to be submitted via the eFiles system. Please have a Senior Official (Director level) send an email to the administration team at review@paab.ca with the contact information of the person(s) who will be designated as administrator(s) for your company. Click on eFiles, on the menu, then eFiles Tutorial for a tutorial on how eFiles works.
Please contact the admin team at PAAB if you need assistance with eFiles
 Community Forum Guide